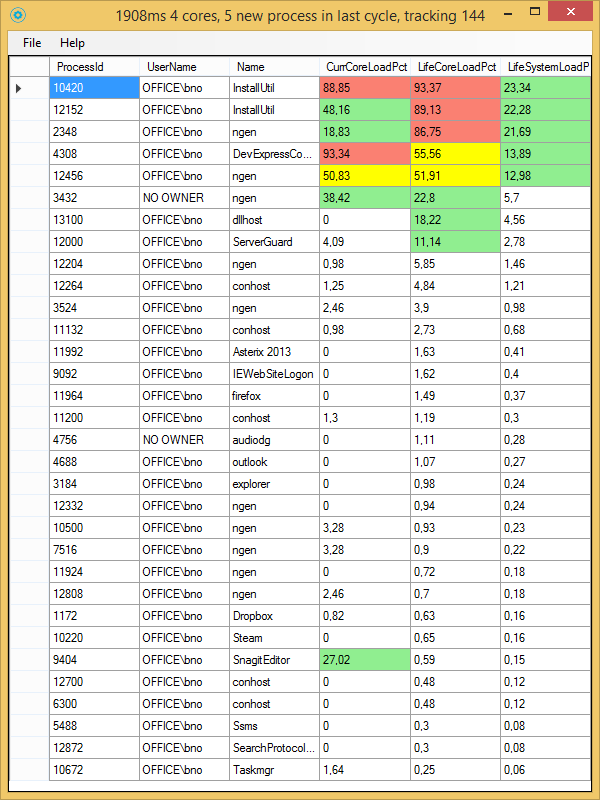
ServerGuard is a simple Windows process monitor that will show you the processes that are running on your server, the owner and the load on the server they are causing. It was written to quickly visualize heavy load users and application on busy terminal server systems. You should run this tool as administrator to be able to see all users processes. ServerGuard will give you two metrics that help look at how expensive process on your server are: A load relative to a single CPU core, and a load relative to the full server capacity.
- Column CurrCoreLoadPct gives you the current load the process is causing weighted to a single CPU core. So a value of 100 means a single core is fully loaded, and a value of 300 means 3 core’s are busy for this process.
- Column LifeCoreLoadPct is the load value over the entire runtime of the process weighted to one core. So a value of 10 here means that over the full runtime of the process from start till now the process has used up capacity comparable to 10% of one core.
- Column LifeSystemLoadPct is the load value over the entire runtime of the process compared to your server’s full capacity.
The display is colour coded to give you an indication which processes are troublesome. The colours are assigned like this:
- 10% or less: White: Your server really doesn’t even notice this process.
- 11%-50%: Green: Your server is working and pulling its weight for this process. It shouldn’t really be a problem thou.
- 51-75%: yellow: Your server needs to use some serious capacity for this process.
- 76% and up: This process is really a heavy load, and/or something fishy may be going on (like hanging processes etc..).
The initial free ware version is version 15.2.19, and can be downloaded from this link: